|
||
|
||
|
Implications of the COBE DMR Map of the Early Universe
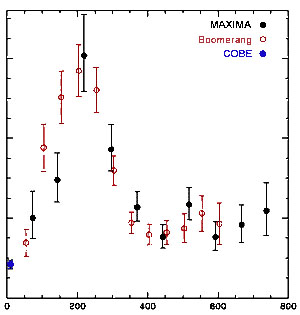
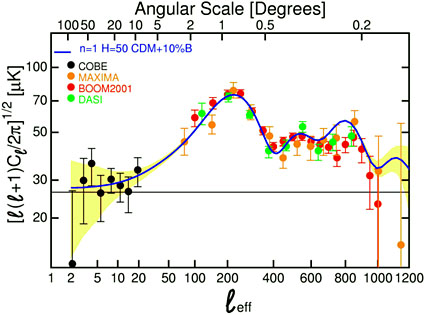
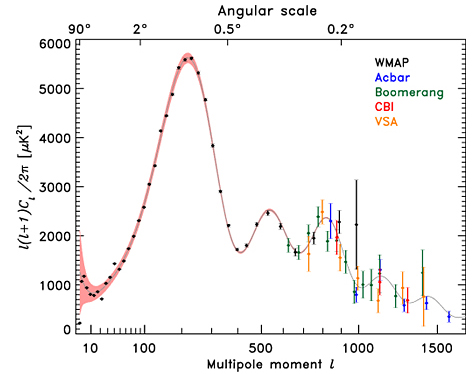
The COBE DMR maps reveal the Universe when it was roughly 300,000 years old (past the beginning of the Big Bang and time as we understand it). This seems to be quite old by human standards until we compare it to the current age of the Universe of about 14 billion (14 x 109) years today. Put in human terms, if the Universe were a middle-aged person today, then the epoch revealed by the COBE DMR maps corresponds to an image of an embryo at 10 hours age. Thus we have an image of the Universe at an extremely early epoch in its development. Second, the COBE DMR showed that the typical amplitude of these fluctuations was essentially independent of their physical size. That is, large length scale fluctuations, medium length, and smaller lengths all have about the same average variations - actually rms or absolute value, as some are negative and some positive, indicating slight over and under densities. This is just the right size dependence (like Goldilocks). If there were bigger amplitudes at smaller scales, the Universe would have a lot of black holes in it. If there were bigger amplitudes on larger scales then there would be giant aggregations of matter pulling everything towards them at high speeds (due to the acceleration of gravity over the 14 billion years since the Big Bang started). This provides the basic input conditions for those studying how stars, galaxies, clusters, etc., formed. Third, the COBE DMR provides information on the primordial conditions in the even earlier Universe. For the scientists that study ultra-high energy physical processes and how the Universe is formed, this information provided the first look into regions where terrestrial accelerators and experiments did not reach (and for some things not likely to reach). Of great interest is what the maps tell us about Inflation. Inflation is a model of the Big Bang where the Universe undergoes a rapid and accelerating (increasingly rapid) expansion very early in its history. This solves problems in the Big Bang scenario (or set up appropriate conditions for it). The long period of acceleration provides a means to smooth out the early universe, taking a small homogeneous region and expanding it to a point where it is now a size larger than we can see today. That expansion would make space nearly flat (Euclidean - meaning there is little or no curvature to our three dimensional space). The expansion also dilutes nearly all initial impurities to the point that they are negligible today. The rapid, accelerating expansion would also generate fluctuations on the otherwise smooth Universe by generating small quantum fluctuations (rapid expansion) and pulling them out to astronomical scales, but frozen in amplitude (accelerating expansion). This rapid, accelerating expansion must be driven by a large energy everywhere in space. At the end of inflation, that energy is converted to the particles and energy the Universe today. Such fluctuations probably requires energies billions to trillions of times higher than any man-made accelerator. It is likely to be at the energy scale of the Grand Unification of forces - the energy at which all forces show that they are the same basic force, and have frozen out to different forces in the cooler, present Universe. We see indications that this might happen from experiments and theory. The CMB maps allows us to explore this region most directly. Finally, the COBE DMR discovery of variations not only meant that many of these theories are supported by the data, but also indicated that further, more precise observations in terms of angular resolution would provide signals to see and theories to be developed (the DMR beam size was roughly 7-degrees). Both theory and observations have made substantial progress in the years since the COBE DMR announcement of variations (anisotropy). It is now clear that the CMB can provide a wealth of cosmological information and has developed into a powerful cosmological probe. In 2000 the MAXIMA and BOOMERANG balloon-borne experiments (and the more detailed DASI ground-based interferometer in 2001) showed that the spectrum of fluctuations has features that move away from scale independence on smaller angular scales. In particular, there were characteristic fluctuations on angular scales of about 1- degree, 1/2-degree, and 1/3-degree. The first peak is strongest, and the next peaks are harmonics, as in music. Following them in 2002, the Archeops balloon-borne detector mapped nearly 1/5 of the sky. 12.5% of the sky was extremely clean and provided a beautiful picture with resolution of 1/6-degree. The location of the first peak provides very strong evidence that the Universe is flat or nearly so - as predicted by Inflationary models. The existence of the first, second, and third peaks is more direct evidence of the acoustic oscillations that were predicted (originally by Andre Sakarov) as the beginning steps before structure formation starts fully. These are powerful confirmations of our cosmological model and show the power of CMB observations.
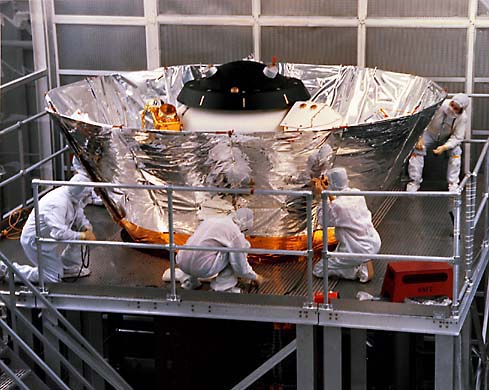
The second CMB anisotropy satellite is the ESA/NASA (European Space Agency/ National Aeronautics and Space Administration) Planck Surveyor planned for launch in 2008 as a third generation CMB satellite. The WMAP results are the first installment of the precision measurements of cosmological parameters that were the promise provided by the COBE DMR discovery.
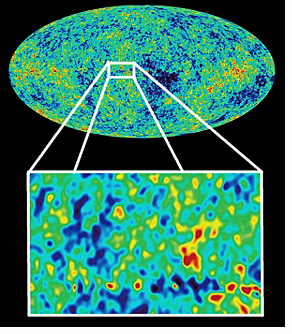
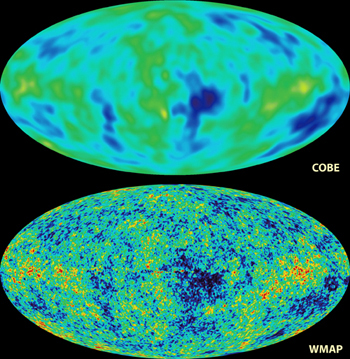
What do the different colors on the map of the CMB represent?
Although the temperature of the CMB is almost completely uniform at 2.7 K, there are very tiny variations, or anisotropies, in the temperature on the order of 10-5K. The anisotropies appear on the map as cooler blue and warmer red patches. These anisotropies, or "ripples" in the temperature map, correspond to areas of various density fluctuation in the early Universe. Eventually, gravity would draw these fluctuations into even denser ones. After billions of years, these minute ripples in the early universe evolved, through gravitational attraction, into the planets, stars, galaxies, and clusters of galaxies that we see today.
|

 The COBE DMR not only made a major discovery about the Universe, but also became the pioneer in a field that is consistently making new observations about our Universe. It set a high standard with the quality of its observations in terms of input and maps, and in terms of its science. Succeeding experiments have had to strive to meet and exceed this high level, and have influenced cosmology as a whole. Most cosmological experiments are now measured in comparison to Planck surveyor and held to superior standards. The excitement following the announcement of the COBE DMR discovery made it more exciting and appropriate to do such experiments, and encouraged funding agencies to support them.